Introduction
Gravity SMTP offers a dynamic and intuitive reports dashboard. This feature gives you a comprehensive overview of your email sending metrics.
The Dashboard
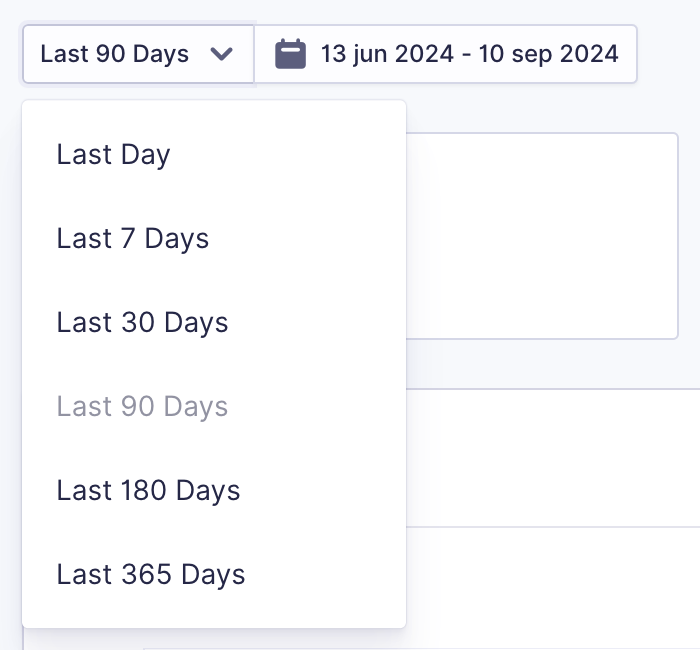
Date Range Selection
It allows you to filter email data by a predefined period.
The filter defaults to Last 90 Days.
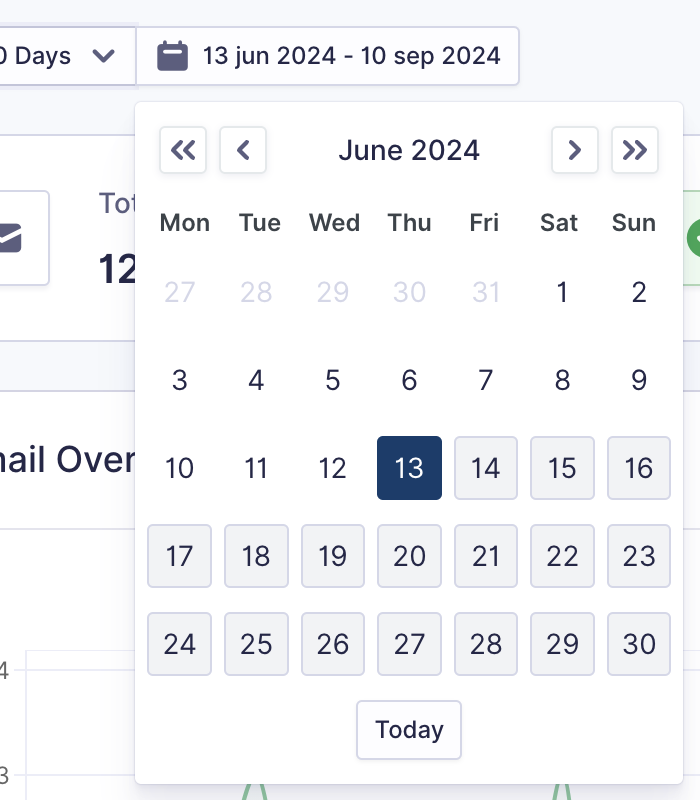
Date Picker Selection
It allows you to filter email data by a custom date range.
The filter defaults to the value selected in the Date Range selection.
Summary Metrics
Provides a quick overview of your email performance.

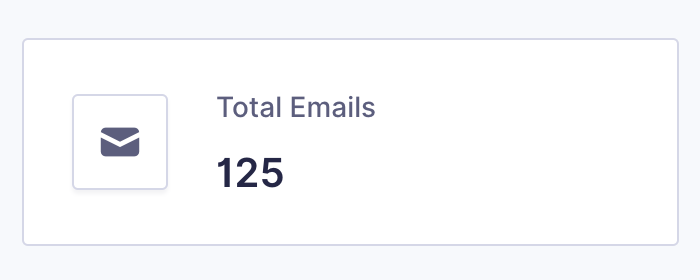
Total Emails
The total number of emails processed within the selected date period.
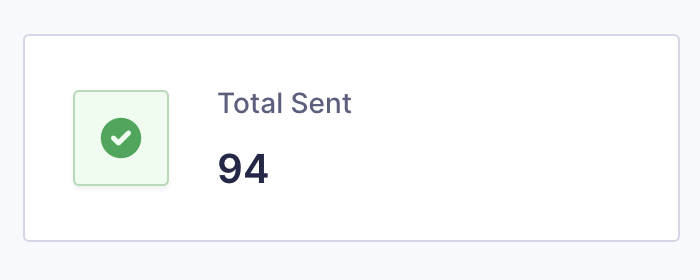
Total Sent
The number of emails successfully sent within the selected date period.
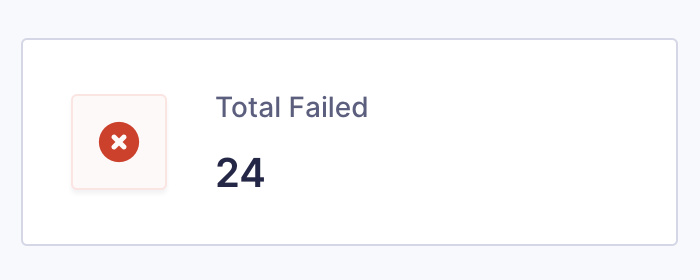
Total Failed
The number of emails that failed to be sent within the selected date period.
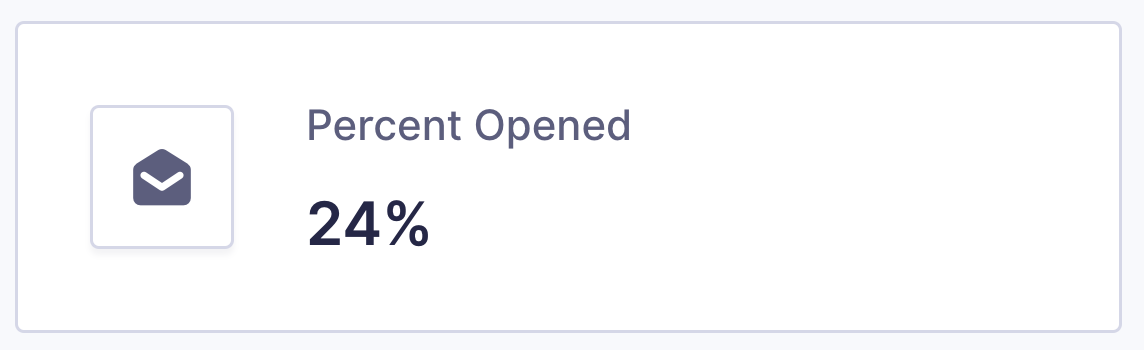
Percent Opened
Email open rate for emails sent.
Email Overview
The chart displays a graphical representation of your email activity over time based on the selected dates.
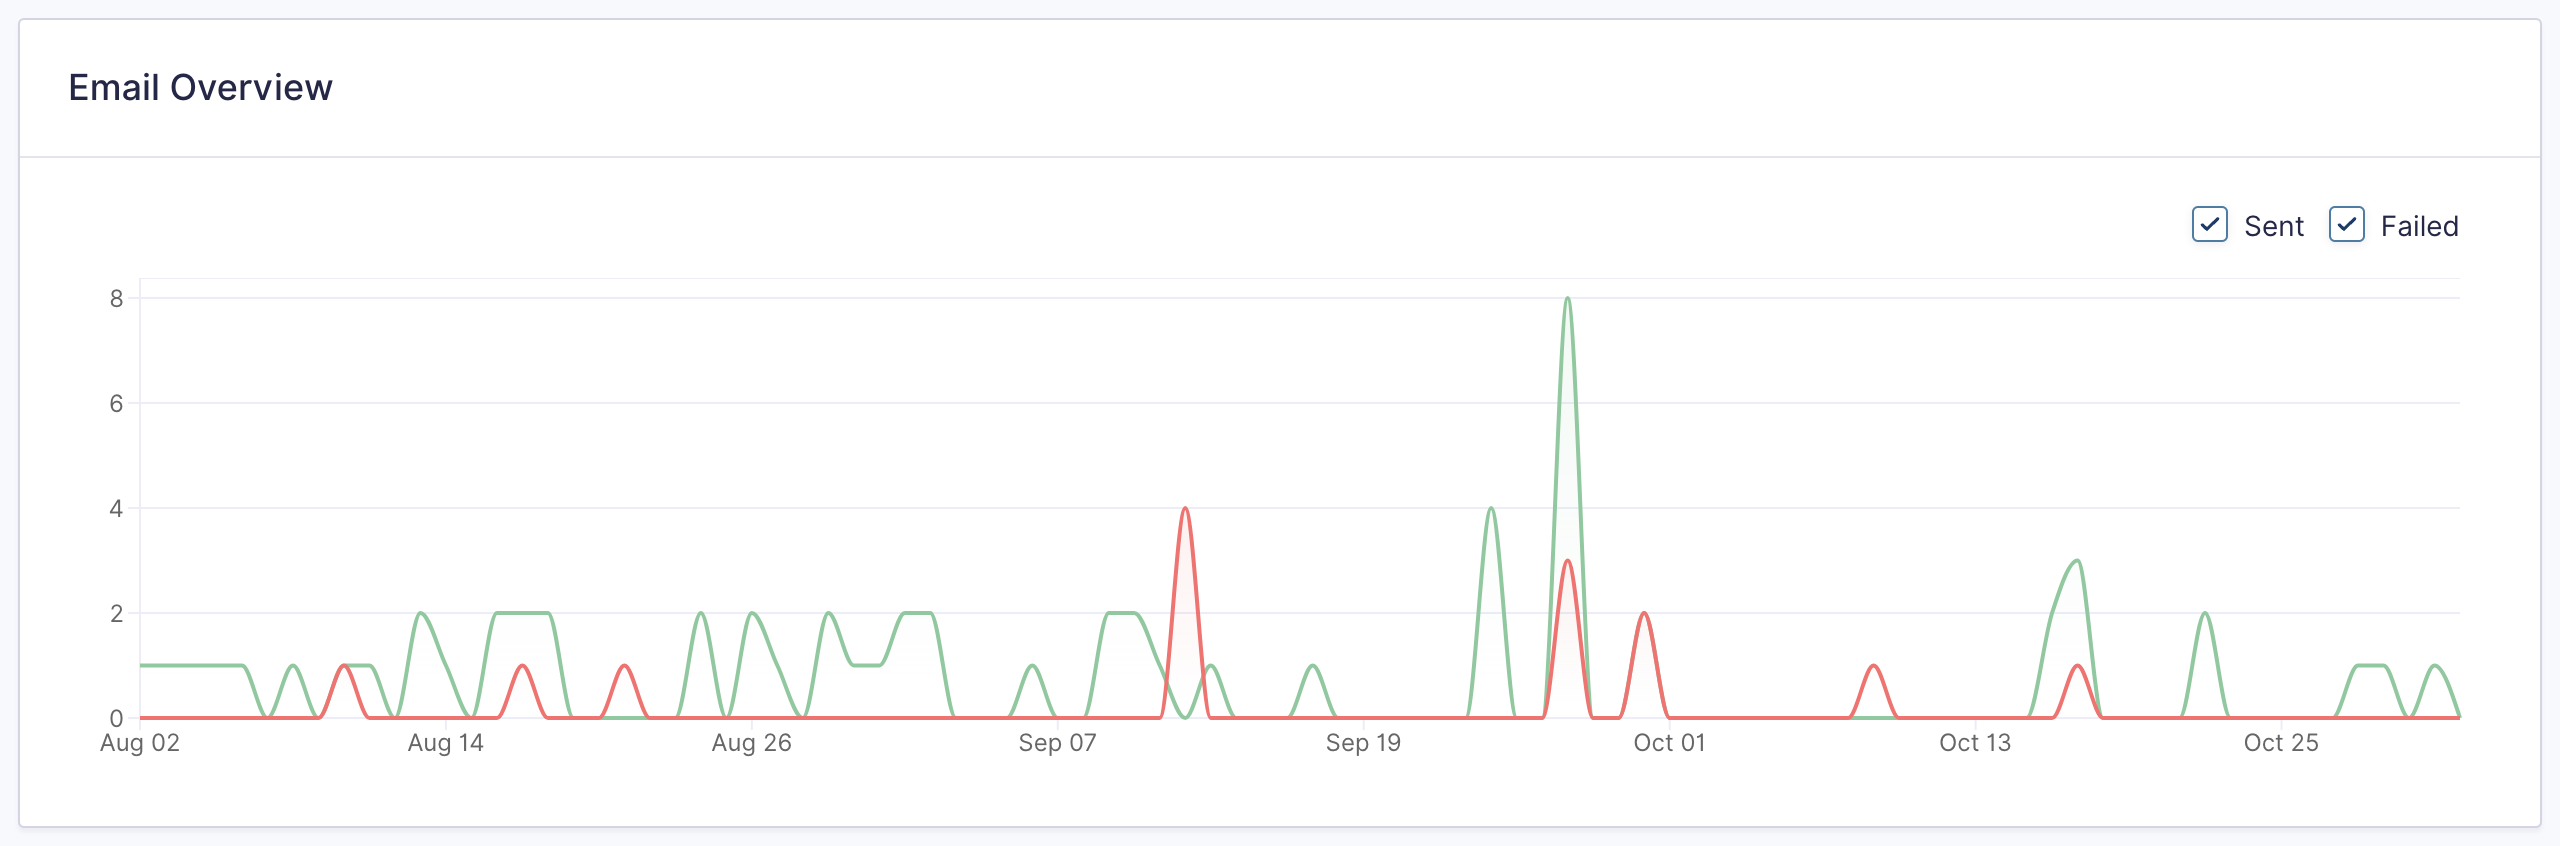
Green Line (Sent)
Shows the number of emails successfully sent each day.
Red Line (Failed)
Shows the number of emails that failed.
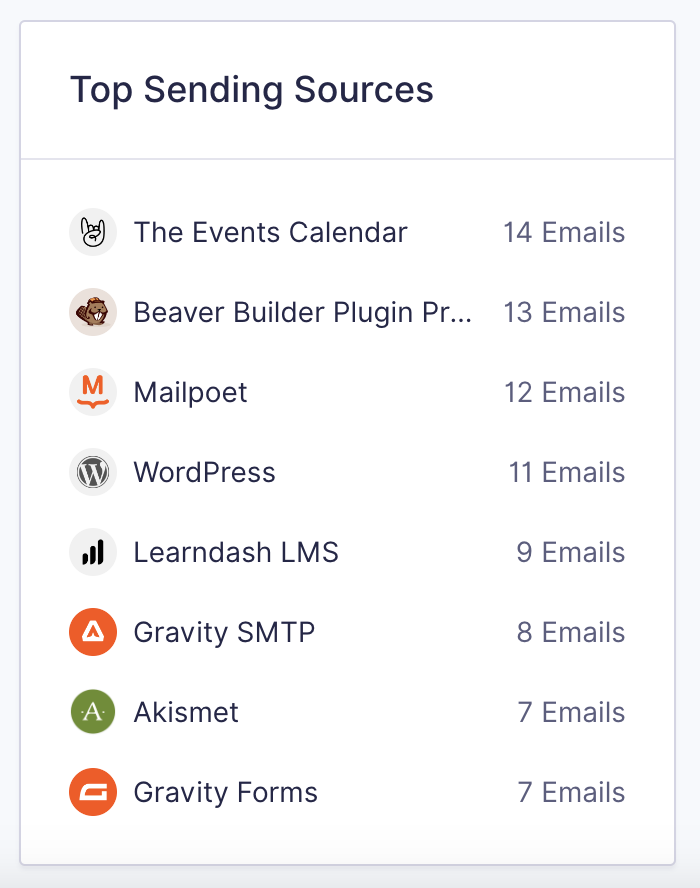
Top Sending Sources
Lists the total number of emails each source sent in the Date period selected.
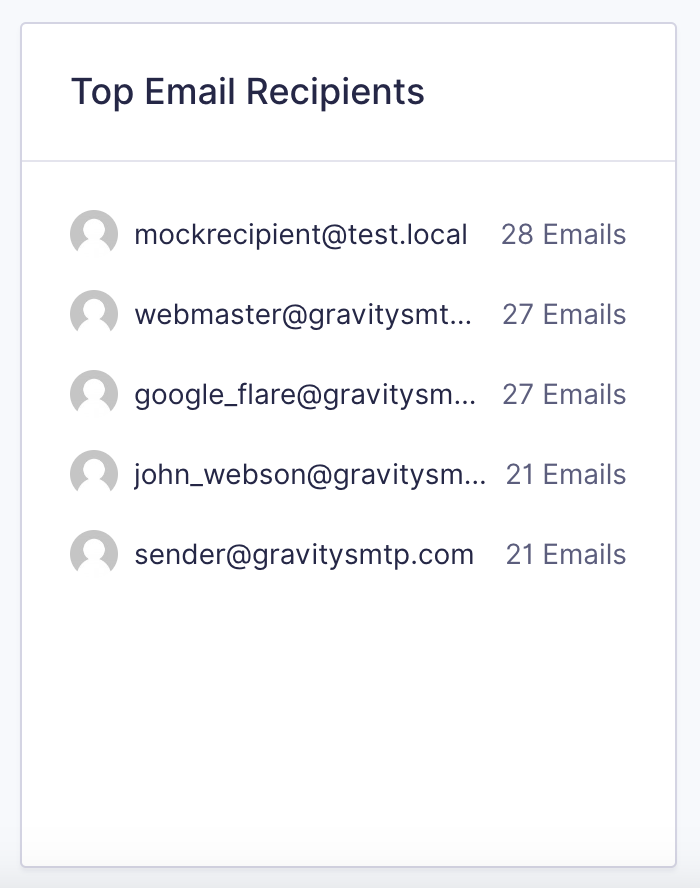
Top Email Recipients
Lists the most frequent recipients of the emails processed by Gravity SMTP within the selected date period.
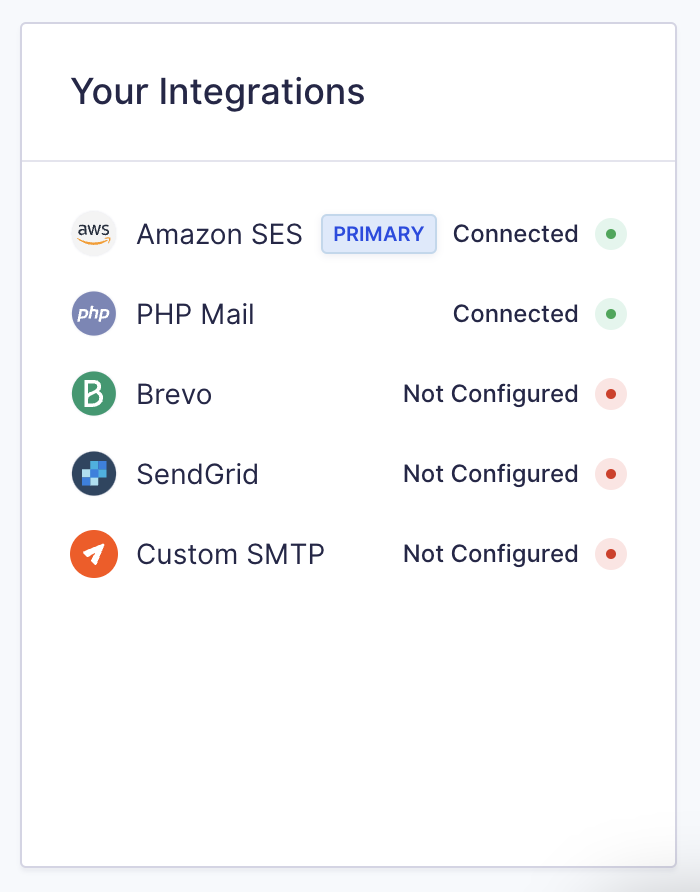
Your Integrations
Lists all the email integrations that are active.
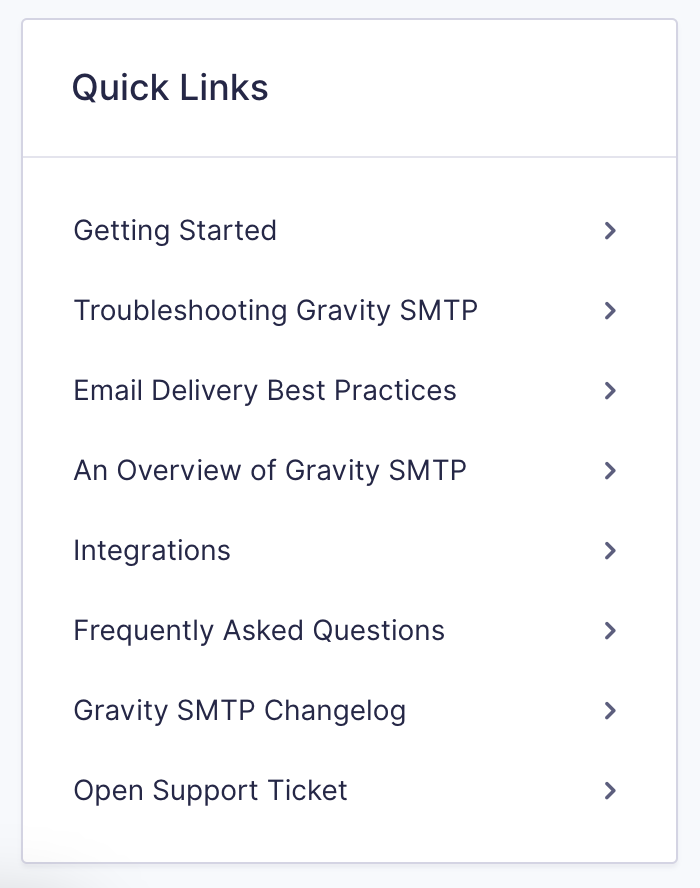
Quick Links
Provides direct access to various resources and support documentation.